
Por: 23 de fevereiro de 2022 3Min de leitura
CFD chart: understand and improve the value stream
CFD Chart – Cumulative Flow Diagram – translating to Portuguese cumulative flow diagram, are stacked area charts that show the number of items in each phase of the value stream.
In other words, CFD Chart is formed through the horizontal axis of the timeline and in the vertical the amount of work items presented cumulatively. In other words, it represents the “picture” of the value stream on a given day, indicating the amount present at each specific stage.
In this way, the CFD Chart is able to demonstrate answers to, for example, these questions:
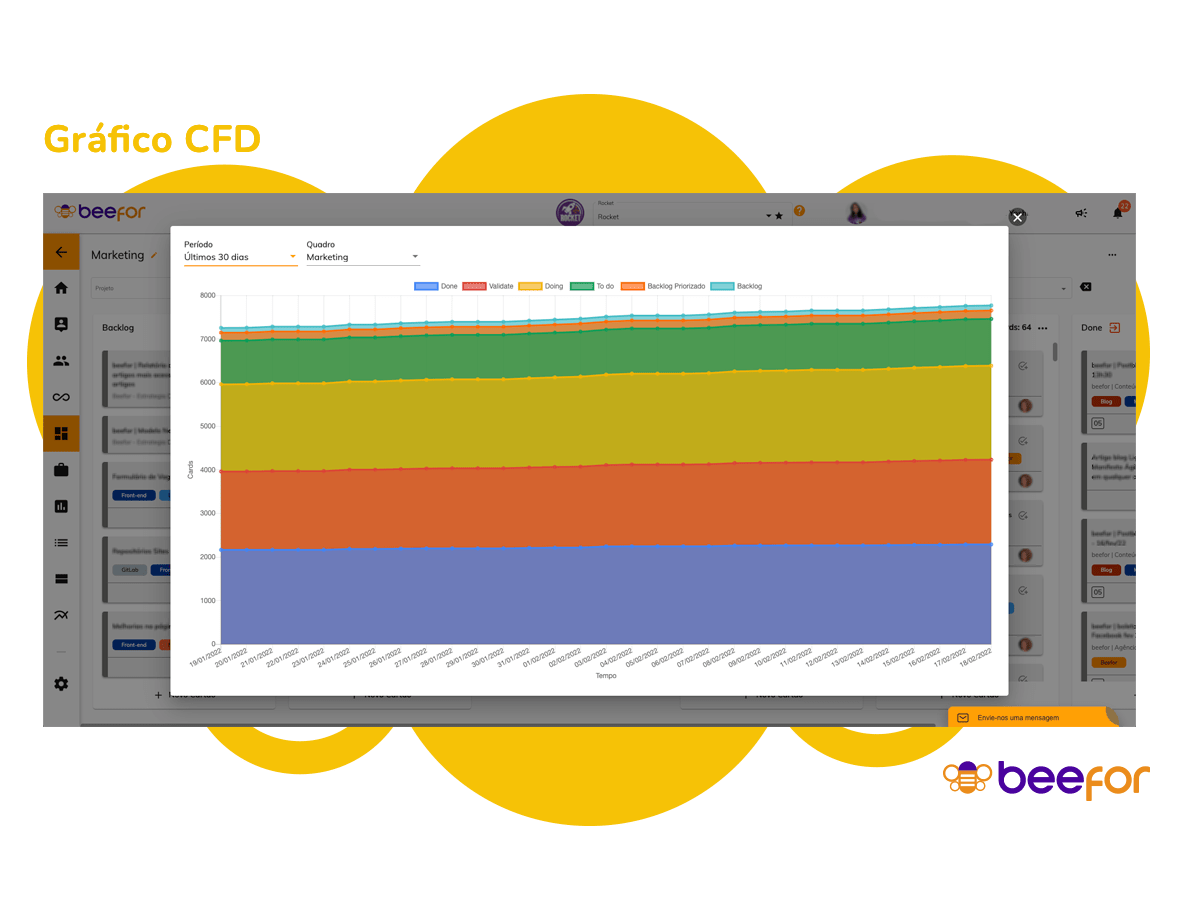
The greater the distance between the step lines, the more items are present at the time of measurement in the process part. Consequently, if it is related to the phase of unfinished items, the number of work in progress will be high, that is, the Work in Process (WiP). Hence the importance of having clear limit policies and identifying the break-even point without creating bottlenecks and achieving continuous delivery.
So, as you begin to understand reading the CFD Chart and how items behave within each step of the value stream, you can ask the right questions to correlate with other metrics or data and make improvements that can generate value.
Through experience using the beefor platform will be able to analyze flow metrics. Also, use the data to implement continuous improvements aimed at stabilizing the product/service value stream.
Try it right now, it’s free and you don’t need a credit card 😉
Finally, analyzing the result data of each stage of the value stream from various perspectives allows for a holistic view of the variables that need to be optimized. Articles in this series of metrics that might interest you:
